
Reporting built around each client's business
Your clients have different business models, objectives and reporting structures. I build the data model, dashboard views and analytical logic around those differences, so the reporting supports the decisions your agency is responsible for.
Ecommerce
Analyse revenue, acquisition efficiency, budget pacing and creative performance across products and markets. Identify where to investigate, refresh creative or adjust investment.
Lead generation
Review campaign results alongside website engagement, with reporting organised around developments, locations or service lines. Include lead-quality data where it is available.
Fundraising
Assess donation revenue, acquisition costs and campaign performance against fundraising objectives. Use historical results to inform creative and budget decisions.
Campaign reporting, creative analysis and optimisation.
Each build draws on Reforge's analytical framework, with the reporting views and modules selected for your client's objectives and available data.
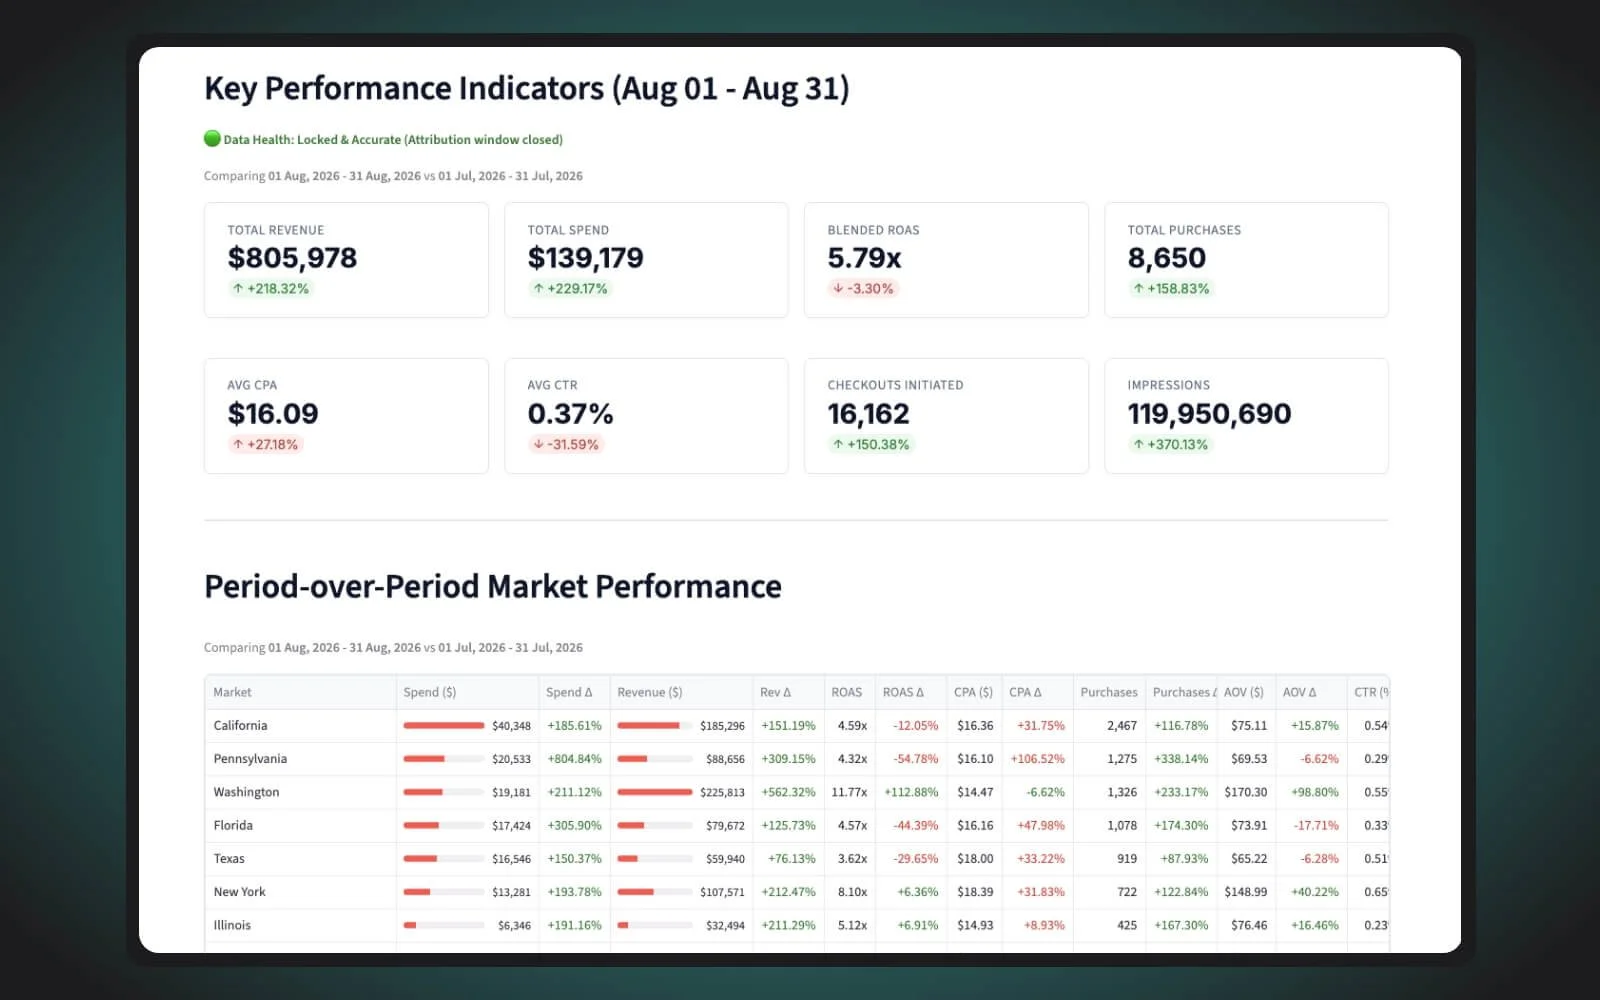
Strategic Dashboard
Review spend, outcomes and efficiency across the areas that matter to the account.
Break performance down by campaign, channel, market or development to prepare client reporting and identify priorities for further analysis.
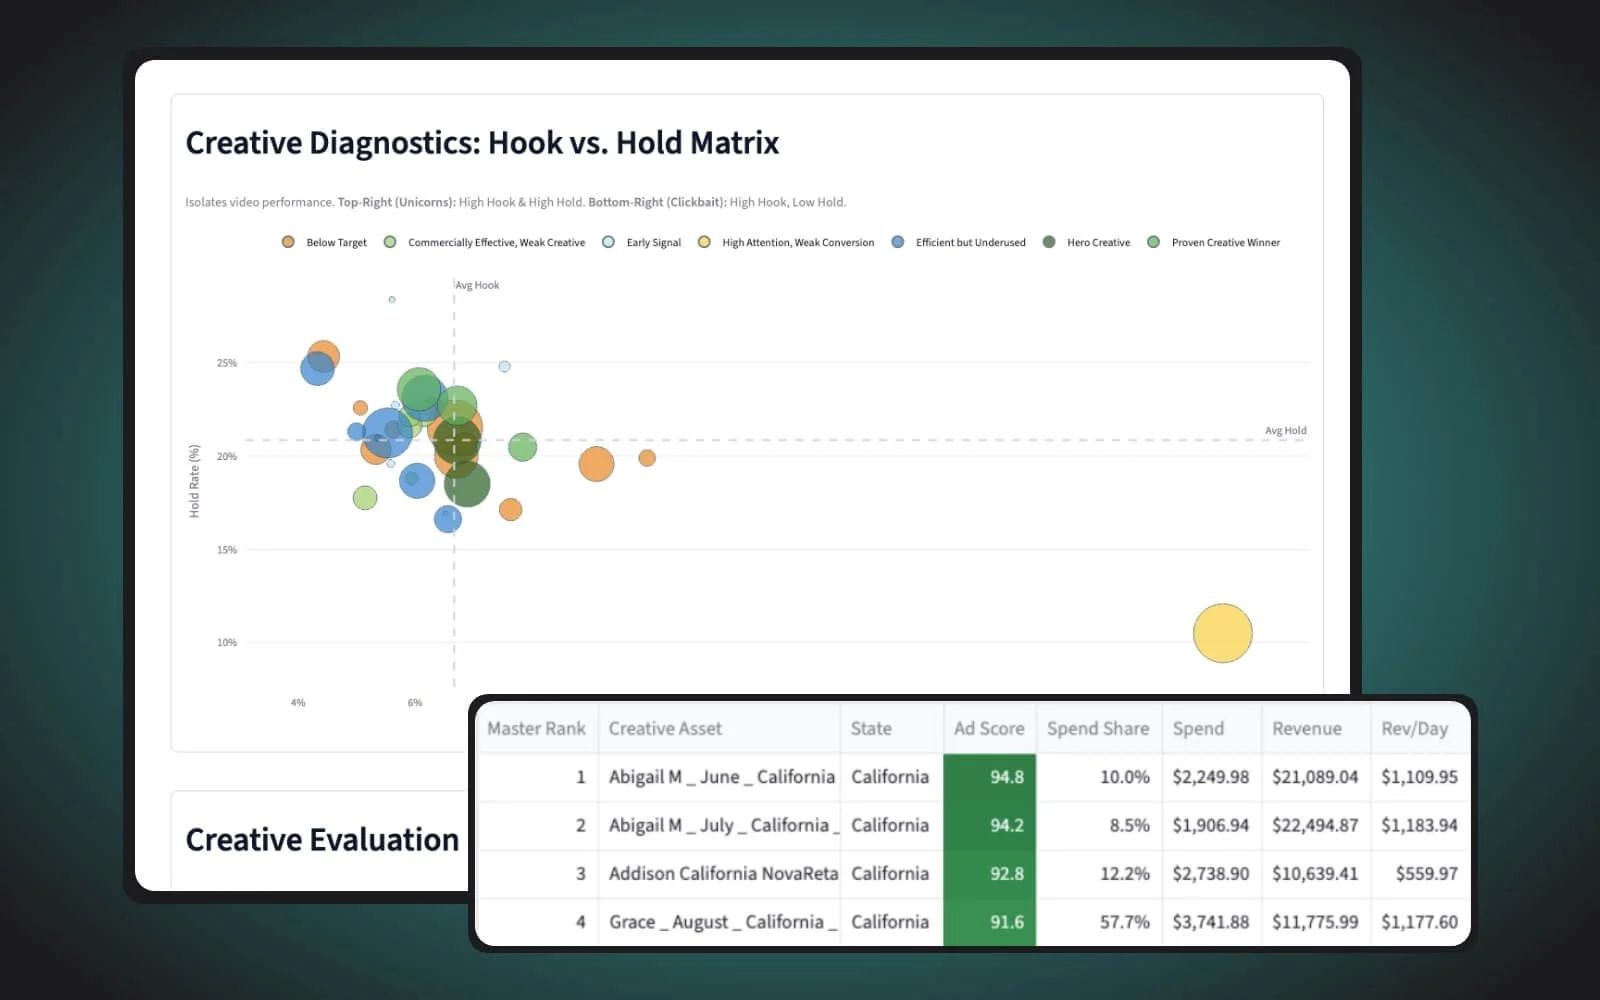
Content Analysis
Compare creative assets, concepts, formats and creators using a weighted grading framework configured around the account.
Scores can reflect commercial performance, delivery volume and the evidence behind each result, helping your team prioritise what to develop and test next.
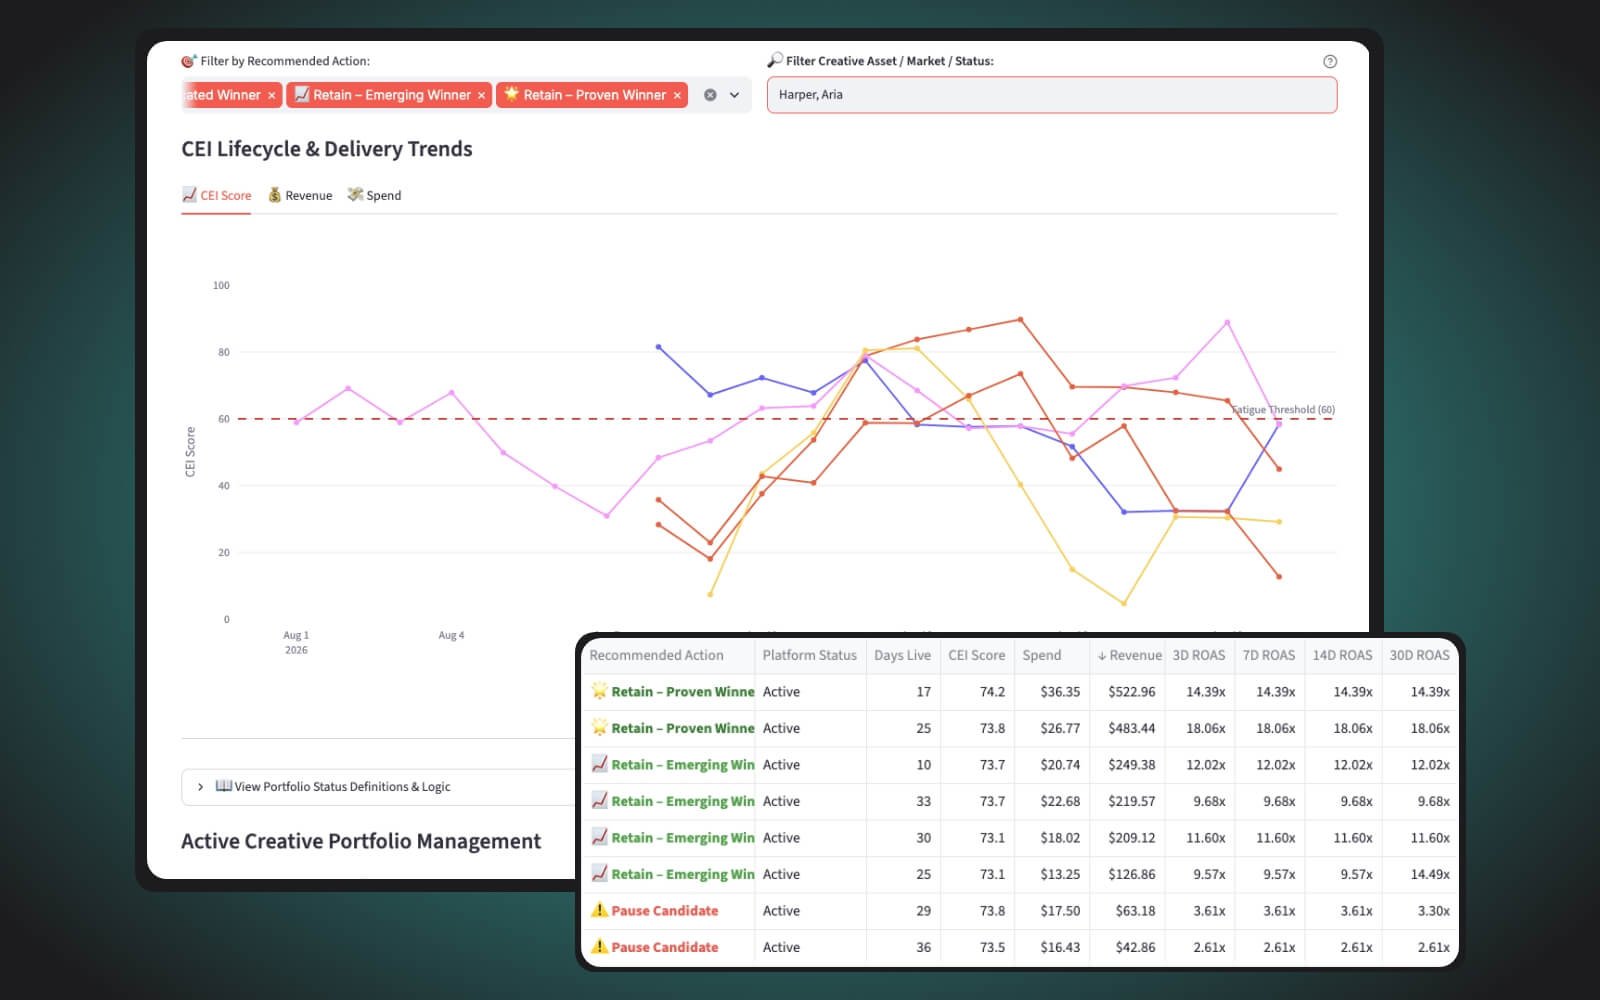
Optimisation Hub
Track how individual ads perform over time. Compare 3-, 7-, 14- and 30-day results alongside spend and time live.
Configured rules flag opportunities to scale, investigate, refresh or reduce investment. Your media team uses the analysis to decide what action to take.
Budget pacing
Compare spend with the agreed monthly budget. Calculate the remaining allocation and the daily spend required to meet the plan across accounts or markets.
Creative fatigue analysis
Identify when observed performance falls below an agreed threshold or declines from an earlier peak. Compare patterns by format and market to inform refresh planning.
Funnel diagnostics
Review advertising and website conversion signals to identify stages that need investigation. Give the team a clearer basis for reviewing landing pages, checkout journeys or enquiry forms.
A bespoke build, with ongoing support
We start with the client's objectives, available data and reporting requirements. I then define the scope, deliverables, timeline and fees in a statement of work.
Dashboard development
I structure the agreed data sources, build the reporting views and configure the analysis. The initial delivery includes validation and a walkthrough so your team understands how to use the dashboard.
Managed data updates
I update and process the agreed datasets on a schedule that fits your reporting needs. Monthly, weekly or business-day refreshes can be scoped according to the level of monitoring required.
Consultancy and development
Book support for interpreting results, preparing client reviews and planning optimisation. Further development can add reporting views, data sources or analytical logic as the client's requirements evolve.
You can commission the dashboard and managed updates as a standalone engagement, then add consultancy when you need it. Campaign management can also be scoped separately.
Bring the relevant data into your reporting
Current Reforge implementations use Meta Ads, TikTok Ads, GA4 and Google Search Console. Other exportable datasets can be assessed and included in the agreed scope.
I prepare and process the data on the schedule we agree. Reforge then runs the configured calculations, scoring and diagnostic rules. Advertising and website metrics retain their source and measurement context, so the team can understand what each result represents.
- Meta Ads
- TikTok Ads
- Google Analytics 4
- Google Search Console
- Agreed data exports
- Reforge processing and analysis
- Client dashboard
Senior marketing experience. Hands-on technical delivery.
I’m Chris, a freelance marketing consultant based in the North East, working with brands and agencies across the UK. My background spans creative production, paid media, website development and performance analysis, including my role as Director of Creative Performance at THG Studios.
I developed Reforge Metrics through live client work, building Python dashboards to support campaign management, creative evaluation and commercial reporting. I handle the data structure, development and analysis myself, and work directly with your team to apply it.
Alongside Reforge, I provide Meta Ads management and TikTok Ads consultancy. You can commission the reporting platform independently or discuss a wider engagement.

Questions about Reforge Metrics
Yes. I can build and maintain the dashboard while your team continues to manage the advertising. Consultancy is available for interpreting the analysis, preparing client reviews and planning optimisation.
I configure the data structure, reporting views, metrics and analytical rules around the client’s business and strategy. An ecommerce dashboard might focus on revenue, creators and markets; a property dashboard might organise performance by development and lead-generation activity.
Current implementations use Meta Ads, TikTok Ads, GA4 and Google Search Console. Other sources can be assessed where suitable exports are available. I review the data and reporting requirements before confirming the scope.
We agree the refresh frequency around your reporting and decision-making needs. This can be monthly, weekly or each business day. I manage the agreed data updates, and Reforge processes the supplied data through its configured analysis.
Yes. Your team can access the dashboard for the agreed client implementation. Access requirements are defined during setup, and I provide a walkthrough of the reporting views and analysis.
Yes. Additional dashboards can be commissioned for other clients. Each implementation is scoped around its own data, business model and reporting requirements, using the underlying Reforge platform and methodology.
The initial build is quoted around the agreed data sources, dashboard views and analytical requirements. Ongoing data updates are priced according to the refresh schedule, with consultancy and further development scoped separately. These are set out in the statement of work before the engagement begins.
Yes. I also work directly with brands, charities and in-house teams. The same approach applies: a dashboard configured around your objectives, with the data updates and consultancy you need.
Discuss the reporting
your clients need
Tell me which clients you support, what data you work with and which decisions your current reports leave unresolved. I’ll help define a Reforge implementation and support arrangement around those requirements.
On an initial call, we’ll discuss:
- Your client’s objectives and current reporting process.
- The available data and the questions the dashboard needs to answer.
- The scope, update frequency and level of support required.
Working directly with a brand or in-house team? The same approach is available for your business.