
Case Study | Scaling iHerb’s TikTok Ads across 14 European markets
Working with Nonsensical, I combined hands-on campaign management, creative analysis and bespoke Reforge Metrics reporting to support iHerb’s European growth. In Q2 2026, the campaigns delivered $3.6M in TikTok-reported revenue at a 4.7x ROAS.
- Campaign management & European market expansion
- Creative strategy & creator performance analysis
- Bespoke reporting development & ongoing consultancy
Project Highlights
Project overview
Working alongside TikTok agency Nonsensical, I took ownership of iHerb’s paid TikTok programme, growing quarterly reported revenue from around $2.2M in Q1 2026 to $3.6M in Q2. Driving approximately 66% quarter-on-quarter growth, the Q2 programme delivered a 4.7x reported ROAS and averaged around $1.2M in revenue per month.
I engineered this growth through a highly connected approach to campaign management and commercial analysis. Beyond launching new European markets and actively managing investment, I developed Reforge Metrics, a bespoke reporting framework designed to track individual ad performance day by day. Crucially, when TikTok’s Smart+ algorithm changed the platform's operating model, I rebuilt both the campaign architecture and the supporting software to future-proof the agency's capability and sustain revenue growth above the agreed ROAS target.
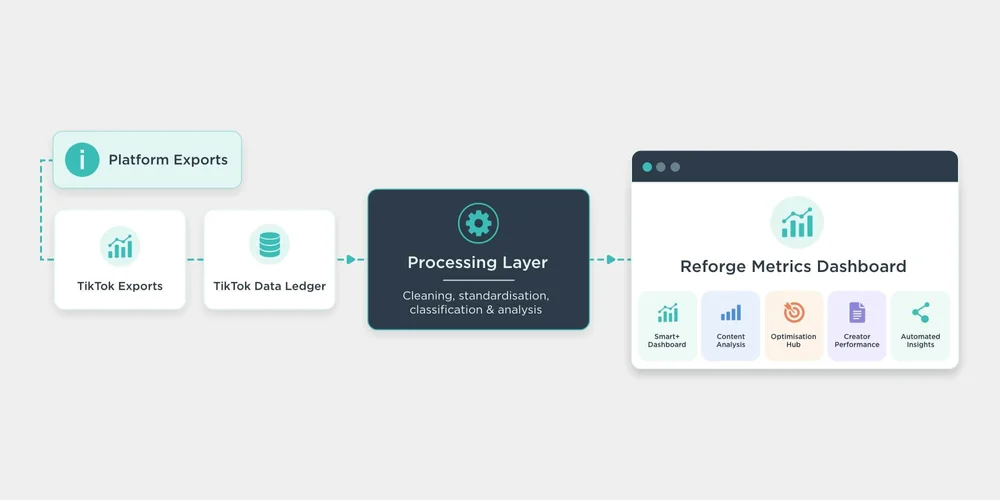
TikTok Ads platform exports feed a dedicated data ledger before cleaning, standardisation and classification within the processing layer. The structured data is then visualised across distinct modules in the Reforge Metrics Dashboard. This diagram illustrates an export-based workflow, not a direct API or real-time platform integration.
The operational challenge
Scaling a TikTok programme of this size presented a dual challenge: we needed to aggressively launch new European markets and increase overall revenue, all while strictly maintaining a 4.0x ROAS. As the account expanded, the operational complexity multiplied. We needed to determine exactly how many creators and assets were required per market to prevent ad fatigue, but top-level account averages were obscuring the granular data required to make those decisions.
Project objectives
Drive profitable scale: Expand the European programme and increase revenue while fiercely protecting the 4.0x ROAS baseline across all new and existing markets.
Accelerate creative intelligence: Establish a highly efficient analytical process to extract creative insights faster, feeding hard data back to Nonsensical to inform their ongoing creator sourcing and content production.
Architect proactive systems: Anticipating the sheer complexity of the expanding account, proactively build a bespoke reporting framework capable of isolating individual ad performance to guide daily media buying decisions.
My role and the agency partnership
From January to September, I operated as the dedicated paid media arm of the account. Rather than just executing campaigns, I took full hands-on ownership of the TikTok strategy, budget management, and daily optimisation. To support this scale, I built the Python and Streamlit reporting infrastructure required to guide our tactical buying and inform our quarterly business reviews.
This commercial success was built on a deeply symbiotic partnership. Nonsensical did an exceptional job leading the overarching agency relationship, handling all creator negotiations, and driving the creative production. They supplied a high-quality, high-volume content engine, and I worked seamlessly within their team - feeding hard performance data back into their operation to guide future concepts and formats. Together, working within the commercial priorities and approvals set by iHerb, we connected brilliant creative execution with rigorous media buying.
Establishing control before scaling
The original programme began with four core European markets. To ensure strict financial discipline, I organised campaigns by market and isolated individual creative assets into separate ad groups. This structure gave me direct, granular control over the budget supporting each specific piece of creative.
Rather than treating an isolated spike in ROAS as a reason to scale, I assessed every test in the context of its broader delivery history. I scaled investment strictly behind ads demonstrating sustained commercial performance. Conversely, as an asset's returns weakened, I implemented a controlled deceleration - gradually reducing its budget to see if it could still meet the agreed ROAS target at a lower spend before pausing it entirely.
By the end of Q1, this disciplined methodology allowed us to safely expand the programme to 14 European markets. Before unlocking further investment, I evaluated each market’s maturity, creative availability, and baseline efficiency. Because several launches had only a partial quarter of delivery in Q1, this rigorous groundwork set the stage for the massive scaling opportunity we captured in Q2.
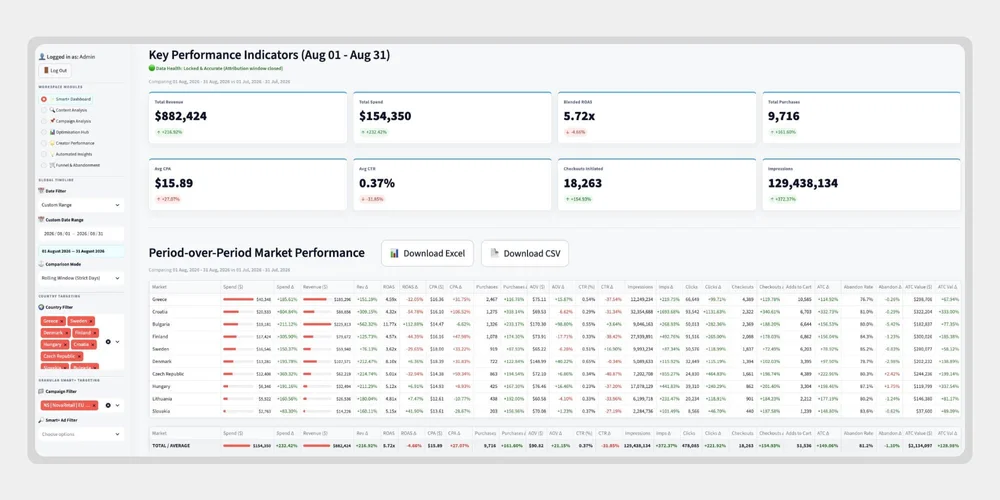
Demonstration data. The main KPI dashboard provides a top-level view of period-over-period market performance. Total revenue, spend and blended ROAS are calculated strictly from the imported platform exports. This view demonstrates the reporting layout and market-level comparison functionality, not actual trading results attributable to this project.
Developing a bespoke commercial intelligence system
Standard reporting software was not equipped to handle the operational complexity of scaling this account. To drive this growth, I architected Reforge Metrics - a proprietary data ledger built in Python and Streamlit. By bypassing rigid API limitations, I developed a sophisticated daily extraction process that fed raw ad data directly into a master ledger. Crucially, I designed this process to extract the previous 14 days of data daily, ensuring that TikTok's delayed attribution was perfectly accounted for in our media buying decisions. Across nine months of reporting, I checked Reforge Metrics against TikTok Ads Manager and confirmed that the dashboard matched the platform figures.
This bespoke approach provided unmatched technical agility. When TikTok made sudden backend changes - such as renaming a core data column - off-the-shelf SaaS platforms would often break, causing severe reporting downtime. With Reforge Metrics, I could patch the schema with a single line of Python, restoring full visibility within minutes and ensuring the agency team never flew blind.
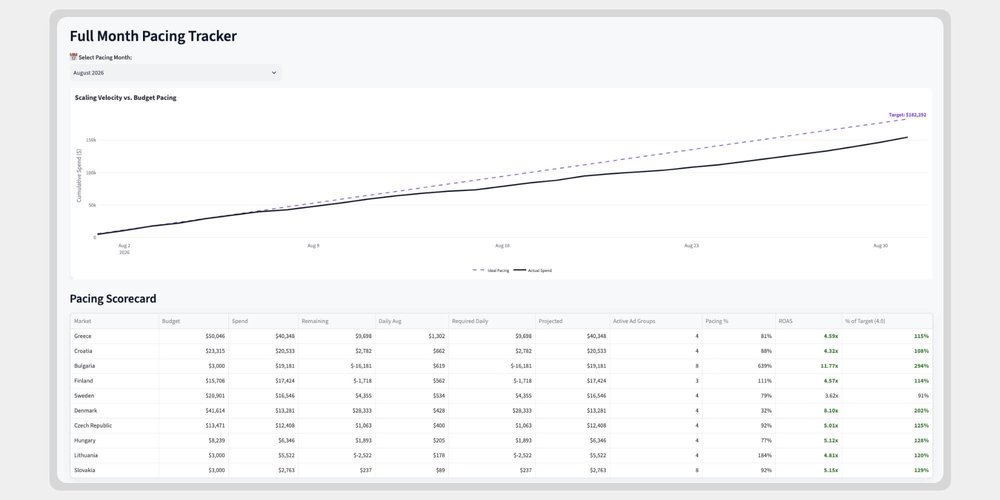
Demonstration data. The pacing tracker plots cumulative market spend against an ideal linear budget trajectory. The scorecard calculates required daily averages, projected outcomes and active ad groups based on the remaining budget. These visualisations illustrate the tracking mechanics used to balance scale with efficiency, not live campaign delivery.
Automated budget pacing
I built a pacing module that connected each market’s monthly budget with actual expenditure. It automatically calculated the remaining allocation, projected delivery, and the daily spend required to meet the month’s plan. This eliminated repeated manual calculations and instantly highlighted which markets were running ahead of or behind their targets.
The Optimisation Hub and Creative Efficiency Index (CEI)
To manage current performance, I built the Optimisation Hub to track individual ad lifecycles day by day, comparing ROAS across 3, 7, 14, and 30 days alongside performance trends and the ad's position in its lifecycle. This granular view revealed exactly when the platform was pushing an asset and when it entered decline.
Rather than relying solely on top-level averages, I developed the Creative Efficiency Index (CEI). This bespoke model evaluated and scored daily performance across multiple underlying metrics, including CPC, CVR, AOV, and CTR. To prevent media buying anomalies from skewing the data, I built strict minimum-data thresholds into the script. If an ad had not crossed specific spend or conversion thresholds, it was classified as being in a 'learning' phase and excluded from scoring. This eliminated false positives, ensuring that a low-spend ad with a single lucky purchase could never outrank a proven asset driving thousands in revenue.
Using the CEI, the system generated automated statuses that exposed recent deterioration that a healthy longer-term average could conceal. These action flags allowed me to instantly execute precise daily buying decisions - whether that meant aggressive scaling, controlled budget reduction, or pausing a declining ad.
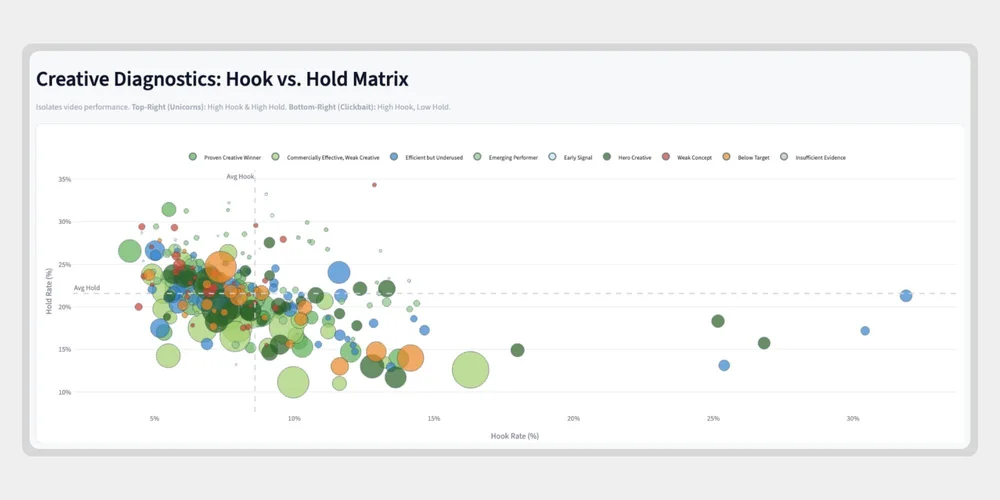
Demonstration data. The creative diagnostics matrix isolates video performance, plotting 2-second hook rates against overall video hold rates. Plotting the assets allows the agency to instantly distinguish high-retention concepts from initial clickbait. This demonstrates the diagnostic framework used to guide future creative briefs, not live audience behaviour.
Connecting creative analysis with production decisions
To isolate winning concepts faster, I built a dedicated Content Analysis module to examine the commercial performance of assets, creators, formats, and concepts. Unlike the Optimisation Hub’s daily tracking, this tool calculated a comprehensive lifetime score for every asset. By evaluating commercial contribution alongside efficiency, I could rapidly identify the repeatable characteristics of winning ads - such as specific opening hooks, daily wellness routines, or product combinations. This turned raw campaign results into precise, evidence-based recommendations, giving Nonsensical clear direction for future production briefs.
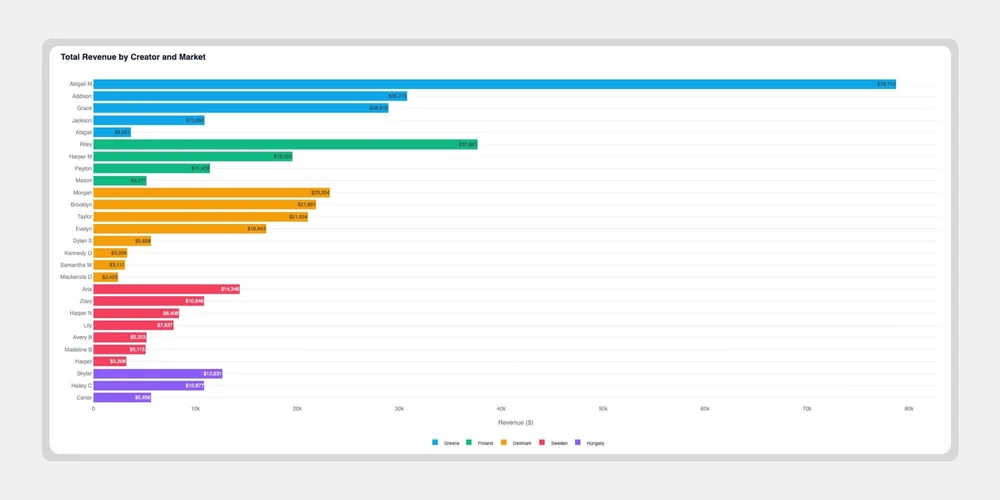
Demonstration data. Revenue by creator and market is mapped to identify top-performing influencer assets across different regions. This specific view relies on strict, standardised naming conventions in the processing layer to group individual ad containers by creator. It demonstrates the analysis structure, not actual influencer performance or commercial returns.
Evaluating creator contribution at scale
Managing content from 2 to 6 creators simultaneously across 14 European markets generated a massive, complex dataset. To evaluate this fairly, I designed a specific creator analysis view that broke down revenue, spend, and average daily revenue by individual creator and market.
To prevent skewed data during roster reviews, I excluded creators with fewer than 30 days live. This ensured we evaluated their average daily revenue accurately, clearly distinguishing a genuinely weak performance from a naturally shorter delivery period or a narrower market footprint. The resulting dashboard gave the agency a definitive, data-backed baseline for their creator roster, instantly flagging exactly who was driving high daily revenue and needed to be retained, and whose concepts needed to be swapped out.
Directing operational strategy through the Creative Fatigue Analysis
To prevent ad fatigue from stalling our growth, I built the Creative Fatigue Engine to track exactly when an asset peaked, how its performance declined, and its average useful lifespan across different formats and markets.
Rather than just observing these trends, I used this data to direct our overarching operational strategy. By establishing the precise, average duration a piece of content remained above the agreed performance threshold, I could mathematically determine how often creative needed to be refreshed and exactly how many creators were required to sustain our scaling efforts. This shifted the account from a reactive stance to a proactive one. I established a continuous, data-backed production cadence, ensuring Nonsensical and iHerb always had replacement assets prepared before the existing pool weakened. Ultimately, this tool seamlessly connected our media buying decisions with their content production planning.
Rebuilding campaign architecture for Smart+
At the start of Q3 2026, the iHerb account moved to Smart+, requiring me to rebuild the campaign structure and supporting reporting. Because legacy campaigns could no longer accept new creative, we had to execute a complete structural rebuild. Smart+ fundamentally changed how the account operated: TikTok now distributed spend automatically across pools of up to 50 creatives, significantly reducing the direct budget control I previously had over individual assets. My strategy had to pivot from manually allocating daily spend to actively guiding the Smart+ algorithm in the right direction.
Restoring granular data and scaling to $1M
This platform migration initially disrupted our reporting, as standard TikTok data now nested individual ad performance inside broader Smart+ containers. To solve this, I executed a substantial rebuild of the Reforge Metrics dashboard. By modifying the data extraction to track the raw creative asset name rather than the overarching ad name, I successfully bypassed the Smart+ container limitation. This critical workaround fully restored our day-by-day visibility and saved our core optimisation and content analysis views.
With granular tracking restored, I could investigate exactly how Smart+ was allocating our budget. The updated analysis quickly exposed instances where the automation funnelled substantial spend into assets with weaker commercial returns. By developing a review process that distinguished established underperformance from new creative still in its learning phase, I gave the agency a precise, practical framework to intervene and correct the algorithmic allocation. Powered by this rebuilt infrastructure, I successfully scaled the account back up to $1M in monthly revenue by August.
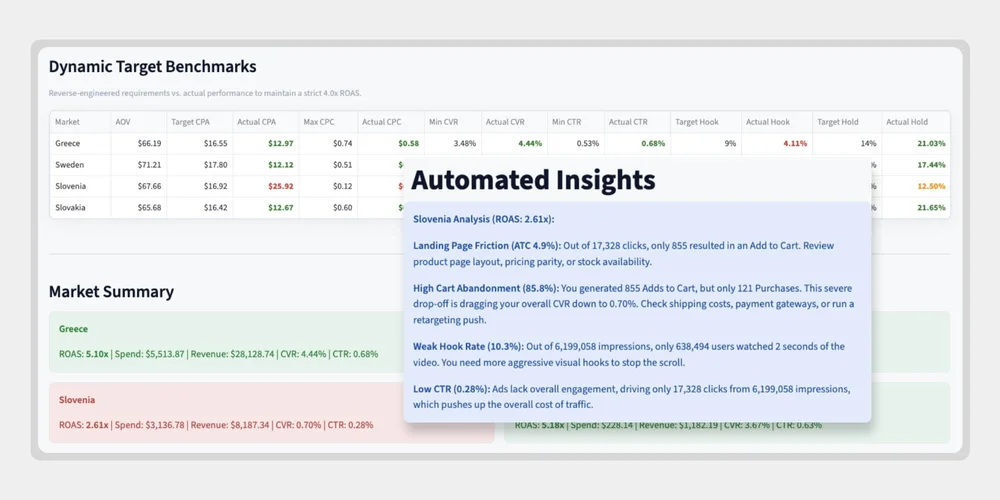
Demonstration data. Dynamic target benchmarks reverse-engineer the minimum conversion and click-through rates required to maintain a strict target ROAS based on market AOV. The automated insights overlay generates rules-based prompts for specific funnel issues, such as landing page friction or high cart abandonment. These views showcase the diagnostic capability of the dashboard, not actual client metrics.
Expanding Reforge with Automated Diagnostics
To speed up the insight-gathering process, I expanded Reforge Metrics beyond standard advertising delivery to include an automated diagnostic engine. The system mathematically calculated benchmarks across all 14 markets for every core metric. Rather than manually digging for problems, the dashboard provided continuous focus and clarity: if our CPA was too high, the system calculated exactly what the underlying metrics needed to be to hit our target.
This automation allowed me to isolate specific failure points instantly and focus my attention where the fix would have the biggest impact. If hook rates or hold rates dropped, I could definitively flag content performance as the issue. If the funnel diagnostics showed high cart abandonment despite strong ad clicks, I immediately highlighted these post-click barriers for investigation.
Directing Funnel and Tracking Improvements
Because website and tracking implementations remained outside my direct remit, I used these automated insights to guide the wider team. I reviewed tracking signal quality, identified measurement requirements for app activity, and analysed recurring day-of-week acquisition trends to propose controlled pacing tests. These findings armed Nonsensical with specific, data-backed questions to take to the client’s technical teams - ensuring conversion barriers were rapidly addressed without assuming a one-size-fits-all spending pattern would suit the whole account.
Making reporting useful to the agency and client
I developed monthly reporting and quarterly business reviews around the decisions the team needed to make. Using iHerb’s market tiers, I connected portfolio results with differences in market maturity, creator contribution, format performance and creative availability.
That meant explaining when revenue growth came from additional investment and newly launched markets, where efficiency was weakening, and what should change next. The dashboard supported the investigation; the reporting translated it into recommendations for budgets, content and further analysis.
I also supported promotional planning, including the Anniversary Sale, by working through offer phases, messaging changes and campaign timing, and preparing the data for the campaign review.
The commercial impact
In Q2, the programme generated around $3.6M in TikTok-reported revenue, averaging approximately $1.2M per month and representing a 66% increase over Q1. By increasing our investment by approximately 96%, we captured massive revenue scale while comfortably defending our baseline efficiency, achieving a reported ROAS of 4.7x, above the client’s 4.0x target. Following the Smart+ transition and reporting rebuild, I scaled the programme back above $1M in monthly reported revenue in August. From late June to September, despite the disruptions of migrating to Smart+, the campaigns recorded more than 30,000 website purchases at an impressive 6.07x reported ROAS.
Strategic value to the agency
Ultimately, this partnership provided Nonsensical with far more than standard media buying. By plugging in as a senior, hands-on paid media arm, I equipped their creative service with bespoke, highly advanced data capabilities. Reforge Metrics evolved continuously alongside the account; as new challenges arose, I built the specific tools required to investigate them. Nonsensical never had to guess what was working. They had direct access to the exact evidence driving our campaigns, ensuring their creative planning and client discussions were always backed by rigorous, undeniable data.
“It's been brilliant working with you Chris - appreciate all your support!”

About Chris Curry
I am an Independent Marketing & Digital Growth Consultant and the creator of Reforge Metrics, bringing over a decade of experience across paid media, creative strategy and performance analysis. Previously Director of Creative Performance at THG Studios, I now partner with agency leadership teams and brands to solve complex growth challenges and translate raw data into scalable commercial returns.
My work combines hands-on TikTok and Meta advertising expertise with advanced data architecture. As demonstrated in this project, I build bespoke Python and Streamlit reporting systems around specific commercial objectives. By bridging the gap between deep technical data extraction and frontend creative strategy, I give agencies the exact evidence they need to make confident, highly profitable decisions at scale.
Scale your TikTok
performance with certainty
I partner with agency leaders and ambitious brands to solve complex digital growth challenges. Through my TikTok Ads consultancy, I provide senior, hands-on campaign management. I also build bespoke Reforge Metrics dashboards to restore data visibility across your accounts.
Tell me what is currently limiting your programme, and we will define the exact strategy required to unlock profitable scale.