
Unsworth Sugden Group | Reforge Metrics Case Study
Bespoke reporting and performance intelligence for an agency and its housebuilder client.
- Data architecture & dashboard development
- Portfolio & development-level reporting
- Creative scoring & optimisation diagnostics
Project Highlights
Project overview
Unsworth Sugden Group commissioned me to build a bespoke Reforge Metrics reporting environment for a housebuilder with multiple residential developments. The brief was to bring paid media, website and creative performance into a more structured system, helping the agency understand performance and identify areas requiring closer attention.
I translated that brief into a tailored application covering executive reporting, Meta performance, creative analysis, optimisation review and GA4 website behaviour. My work extended beyond dashboard design to the data-processing logic, development-level reporting structure and analytical frameworks behind the interface.
The business challenge
The requirement was not simply to display more metrics. USG needed a reporting environment that supported investigation: where performance differed across developments, which advertisements warranted creative review and where website behaviour raised further questions.
The brief called for clearer visibility across paid media and website performance, more useful client reporting and less reliance on static spreadsheets or disconnected views. It also needed a structure that could support ongoing data refreshes rather than becoming a one-off report.
I approached the build around three connected tasks: understanding the overall portfolio, examining individual developments and campaigns, and identifying what deserved attention next.
Project objectives
Bring Meta and GA4 reporting into one tailored environment while retaining clear distinctions between their metrics.
Support both portfolio-wide reporting and investigation of individual housing developments.
Introduce structured creative evaluation and optimisation prompts, with context about the available evidence.
Create an interface that supports repeatable reviews, clear interpretation and data exports.
My role and ownership
I combined reporting strategy, technical development and creative-performance analysis to build a bespoke implementation of Reforge Metrics.
I developed the data-loading and processing logic, structured the reporting around the housing portfolio, designed the interface and implemented the scoring and diagnostic frameworks. The work connected the agency’s reporting requirements with the practical details of how data was organised, filtered and presented.
My remit was the reporting and analysis system, rather than managing advertising campaigns or making changes inside the advertising platforms. The dashboard was designed to support professional judgement, with campaign decisions remaining outside the application.
Building reporting around the housing portfolio
Creating consistent reporting foundations
I built the application around separate Meta and GA4 data ledgers, with a cloud-based loading process feeding the dashboard. For Meta, the processing layer standardises export fields, handles numeric formatting and organises dates before the data reaches the reporting views.
This separates the source-data workflow from the interface. Maintained exports provide the reporting data; the application then calculates and presents the selected views. It is a refresh-based reporting system, rather than a direct, real-time connection to the advertising platforms.
I also retained the distinction between Meta-reported leads and GA4 website activity. Bringing those measures into a shared environment provides reporting context without suggesting they represent the same individual customers or a reconciled attribution journey.
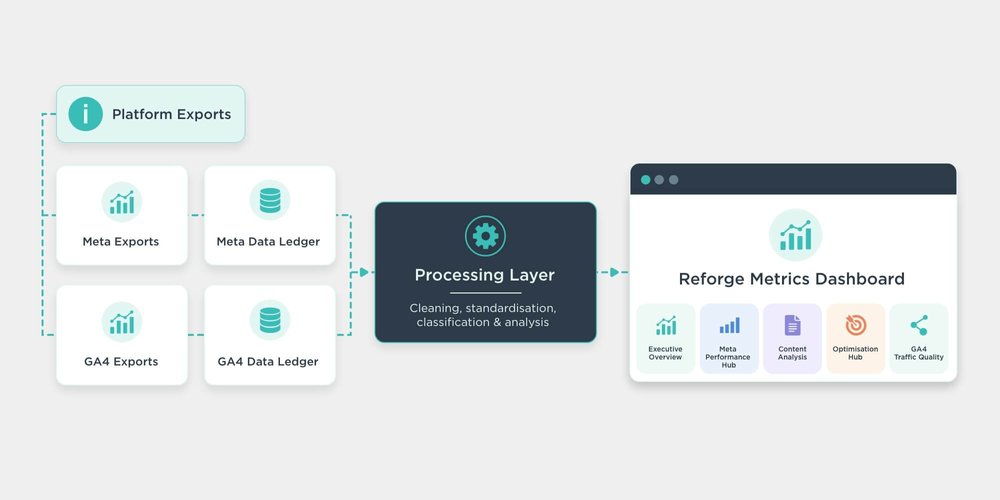
Meta and GA4 exports feed separate data ledgers before processing and presentation in Reforge Metrics. Platform-specific measures remain distinct within the shared reporting environment. This diagram illustrates an export-based workflow, not direct, real-time platform integrations.
Moving between the portfolio and individual developments
I introduced a development-mapping layer so reporting could follow the client’s property portfolio, rather than relying solely on platform campaign names.
The implementation uses campaign naming to associate records with developments. Where GA4 campaign information does not provide a match, it also checks the landing-page field. Records that cannot be classified remain unassigned rather than being forced into an unrelated development.
A shared portfolio filter then allows the agency to focus on selected developments across the Meta and GA4 data. The executive comparison brings development-level advertising spend and leads alongside website sessions and engagement measures.
For the executive CPL diagnostic rules, I retained a wider portfolio benchmark even when an individual development is selected. That avoids a development effectively becoming its own reference point.
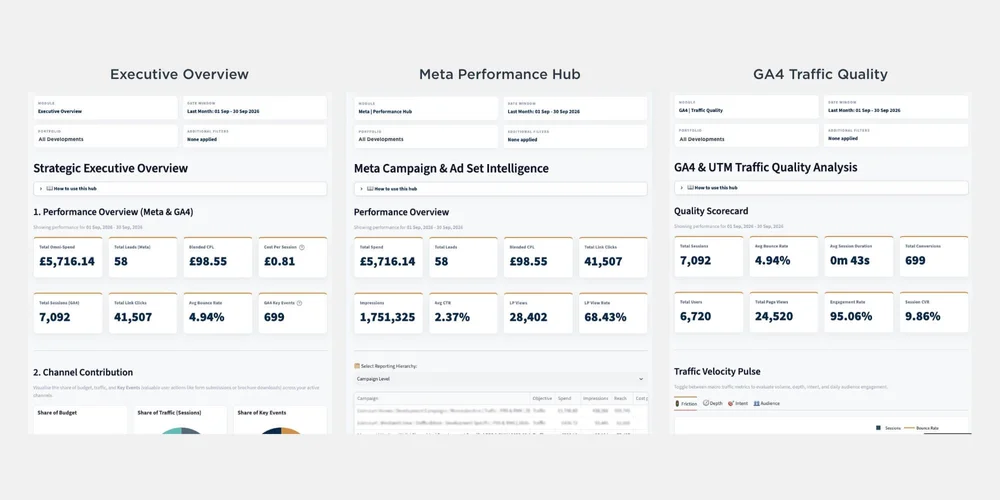
Selected views of the Executive Overview, Meta Performance Hub and GA4 Traffic Quality module. Meta leads and GA4 key events are separate measures, not a single deduplicated conversion total. Cost per session divides Meta spend by all GA4 sessions in the selection, not just Meta-attributed visits. These views demonstrate reporting functionality, not performance improvements attributable to this project.
Five reporting modules, each with a clear purpose
I organised the dashboard into five modules so the agency could move from a high-level overview into campaign reporting, creative investigation, optimisation review and website analysis.
Executive Overview
The Executive Overview provides the starting point: Meta spend, reported leads and CPL alongside GA4 sessions and key events. Development comparisons, traffic trends and rules-based findings provide routes into more detailed investigation.
Meta Performance Hub
The Performance Hub supports campaign, ad-set and ad-level reporting, with daily charts for delivery and acquisition metrics. A scale-versus-efficiency view plots lead volume against CPL for campaigns with recorded leads, while the development heatmap places key performance measures alongside one another.
The purpose is to make volume and efficiency visible together, rather than treating either as a complete assessment on its own.
Meta Content Analysis
The Content Analysis module prioritises advertisements for creative review. It separates lead and traffic objectives, considers the available performance evidence and explains why an asset may need further investigation rather than immediate replication.
Meta Optimisation Hub
The Optimisation Hub focuses on current performance, momentum and delivery status. Its role is distinct from creative analysis: it generates prompts for reviewing active advertising, while retaining historical context for paused or non-delivering assets.
GA4 Traffic Quality
The GA4 module provides website reporting by channel, source/medium, campaign and landing page, alongside time-based views. Sessions, engagement and recorded key events help the agency investigate website activity without assuming that traffic volume alone demonstrates value.
Creative evaluation built around objectives and evidence
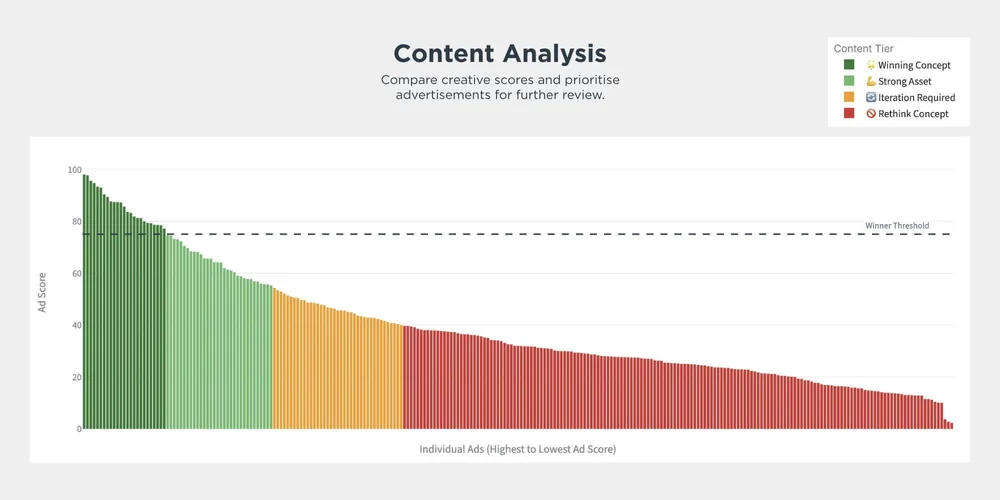
Each bar represents an advertisement, ranked by its creative-review score within the displayed reporting scope. Lead and traffic campaigns use separate scoring frameworks. Scores, tiers and threshold markers help prioritise creative review; they are not conversion rates, proof that a creative concept caused a result, or guarantees of future performance.
Different objectives require different assessments
A key development decision was to avoid applying one undifferentiated score to every advertisement.
For lead-generation activity, I built scoring around reported lead volume, CPL and lead-per-click response, supported by engagement and delivery measures. For traffic activity, the framework focuses on landing-page views, the relationship between clicks and loaded landing pages, and cost per landing-page view. Leads are deliberately excluded from the traffic score.
I also adjusted the engagement weighting for static and carousel assets, reallocating the video component rather than expecting non-video formats to generate video engagement.
This gives the creative review a defined relationship with the campaign’s purpose, rather than allowing an attractive engagement figure to dominate the assessment.
Making the strength of the evidence visible
The headline Creative Learning Priority brings together Creative Signal, Meta Delivery Signal and Evidence Confidence, with additional limits where result volume or quality indicators are weak.
Crucially, the interface shows more than the final score. Confidence tiers and explanatory labels make it possible to see why an asset may appear promising but still require more evidence. Advertisements with limited delivery are separated into their own review queue.
The output is a framework for deciding what to study, vary or investigate. It does not claim that performance data alone can identify the visual element that caused an advertisement to work.
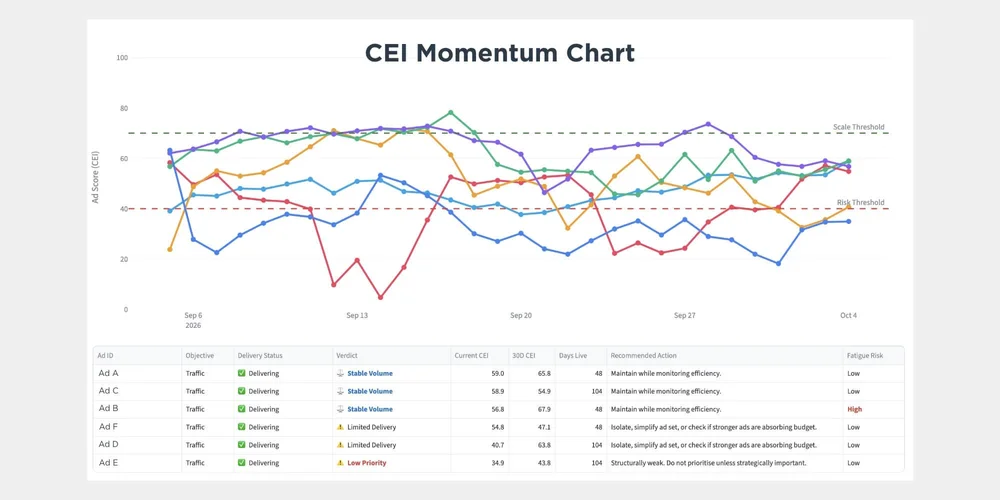
Creative Efficiency Index (CEI) trends are reviewed alongside delivery status and supporting metrics. The reference lines indicate review thresholds, not automatic instructions to increase or stop spending. Recommendations also consider available evidence, momentum and fatigue indicators. The wider module retains paused and non-delivering assets for context while excluding them from active next-step recommendations.
Separating creative learning from optimisation decisions
Reviewing momentum alongside performance
The Optimisation Hub introduces a Creative Efficiency Index, or CEI, alongside recent results, performance trends and supporting metrics.
I built this as a separate assessment from Creative Learning Priority. An advertisement worth studying creatively does not automatically require a budget increase, and an operational decision needs context about current delivery as well as historical results.
The module uses rules to generate review prompts around performance momentum, potential fatigue and inefficient delivery. These are starting points for investigation, not proof of a particular cause or instructions executed automatically within Meta.
Recognising when an advertisement is no longer delivering
I also built delivery-status handling into the optimisation workflow.
The application uses available platform status and recent delivery records to distinguish active assets from paused or non-delivering advertisements. Those assets remain visible for performance context but are excluded from active next-step recommendations.
That distinction carries through to the trend chart. Days without qualifying spend appear as breaks rather than being joined into an uninterrupted performance line.
Together, these decisions give the optimisation view context about whether an asset is delivering, not just how it scored.
Designing the interface around practical reporting
I developed a consistent visual system across the dashboard, including navigation, filters, charts, tables and layouts for smaller screens. The interface also displays the selected reporting period and filters so the context of a view remains visible. Explanatory guides sit alongside the analytical outputs. Users can inspect the meaning of scores, labels and diagnostic fields, rather than being expected to accept a recommendation without understanding its basis.
CSV downloads provide a further route from dashboard review into reporting and analysis work. The application is therefore structured around both presenting information and making the underlying table outputs available for use elsewhere.
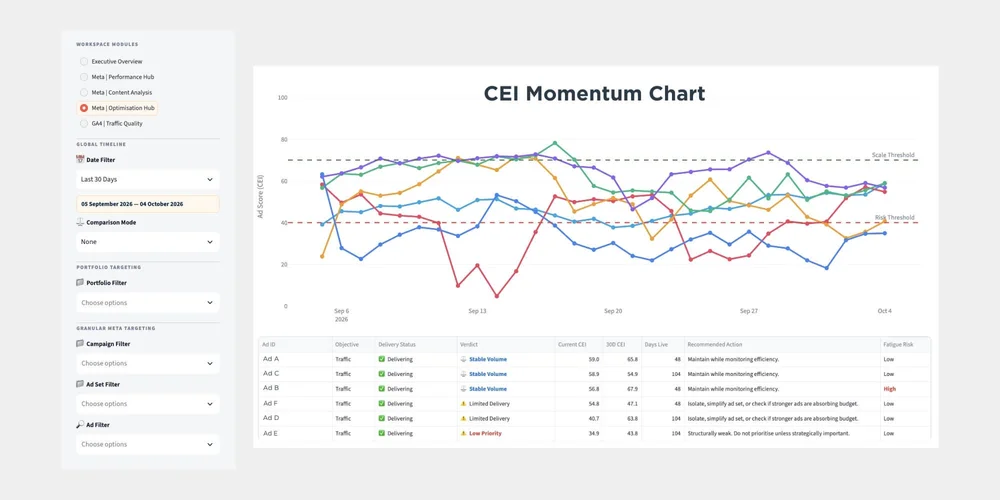
Date, development, campaign, ad set and ad filters allow users to narrow the reporting view. The selected period and filters provide the context for interpreting the chart and table; a filtered view should not be read as a summary of the entire account.
What the project delivered
The project brought portfolio reporting, Meta performance, creative evaluation, optimisation review and website analysis into one bespoke Reforge Metrics environment for Unsworth Sugden Group.
Its value lies in how those capabilities fit together. The agency can move from an overall reporting view to a particular development, examine the advertisements behind the activity and investigate website behaviour within the same application. Creative-review priorities include context about the available evidence, while optimisation recommendations account for delivery status.
My contribution connected the reporting strategy with the technical build: the data structure, analytical logic and interface were developed around the same requirements.
The result was more than a collection of charts. It was a tailored reporting foundation designed to support the agency’s performance reviews, creative discussions and further investigation.
“In just a few weeks Chris has proved himself a huge asset to our business. He’s become the missing link between our social and digital teams and the minefield that is reporting. We appreciate his agency background and connected, in terms of personality, from the first meeting, I knew he’d be the right person to support my team.
“He’s efficient, incredibly knowledgeable, detailed and super friendly. The Reforge tool is seriously impressive and I can see ways in which his expertise will help us with so many things. I feel lucky to have come across his website and frankly am reluctant to share what a find he is!”

About Chris Curry
I am a freelance marketing consultant and the creator of Reforge Metrics, with more than ten years of experience across paid social, creative strategy and performance analysis. Previously Director of Creative Performance at THG Studios, I now help brands and agencies understand their marketing performance and make better-informed campaign and creative decisions.
My work combines hands-on Meta and TikTok advertising expertise with bespoke dashboard development and structured creative analysis. I personally design and build reporting systems around each client's objectives, from organising the data and developing the analytical frameworks to creating an interface that makes the findings easier to investigate and explain.
Need reporting built around your clients?
Reforge Metrics combines bespoke dashboards with paid media and creative-performance analysis, shaped around the questions your agency needs to answer.
I work across reporting strategy, data structure and development to build systems that support both client reporting and deeper performance investigation.