Why marketing dashboards don’t answer the right questions
Designing reporting around decisions, not just data
A standard marketing dashboard can tell you exactly how much you spent, what revenue the platform reported, and whether your return on ad spend increased. However, when an agency team needs to decide which ads deserve more budget, which creators to recommission, or why a specific market is falling behind, those top-level numbers are only the starting point.
The issue is rarely the software itself. As Microsoft’s dashboard guidance highlights, effective reporting must start with the audience, the specific decisions they need to make, and the context required to understand each number. When dashboards are built by simply displaying available metrics rather than mapping to human decisions, they leave the most critical commercial questions unanswered.
This is the exact problem I set out to solve. Through my live client work I developed Reforge Metrics. The system was not built by looking at what data was available; it was shaped entirely by the operational questions that arose while actively running and scaling those campaigns. This article explains that practical process, providing agency owners and paid media teams with a framework to ensure their reporting actually supports clearer, faster decisions.
What questions should a marketing dashboard answer?
When I develop reporting, I start by asking what someone needs to decide, how often they must decide it, and what evidence will actually help.
A paid media manager reviewing budgets each morning needs recent performance and delivery context.
A creative team planning its next production cycle needs to understand which concepts are genuinely worth developing.
An account manager preparing a client review needs a definitive explanation of what changed and what the team recommends doing next.
These operational requirements must dictate the analysis.
These examples demonstrate that answering a commercial question usually requires additional, specific context that a standard dashboard simply does not provide.
Why totals and rankings can hide declining performance
Two examples from my client work show why relying on a useful headline figure can still leave a critical commercial question unresolved.
A strong overall ROAS can hide a weakening ad
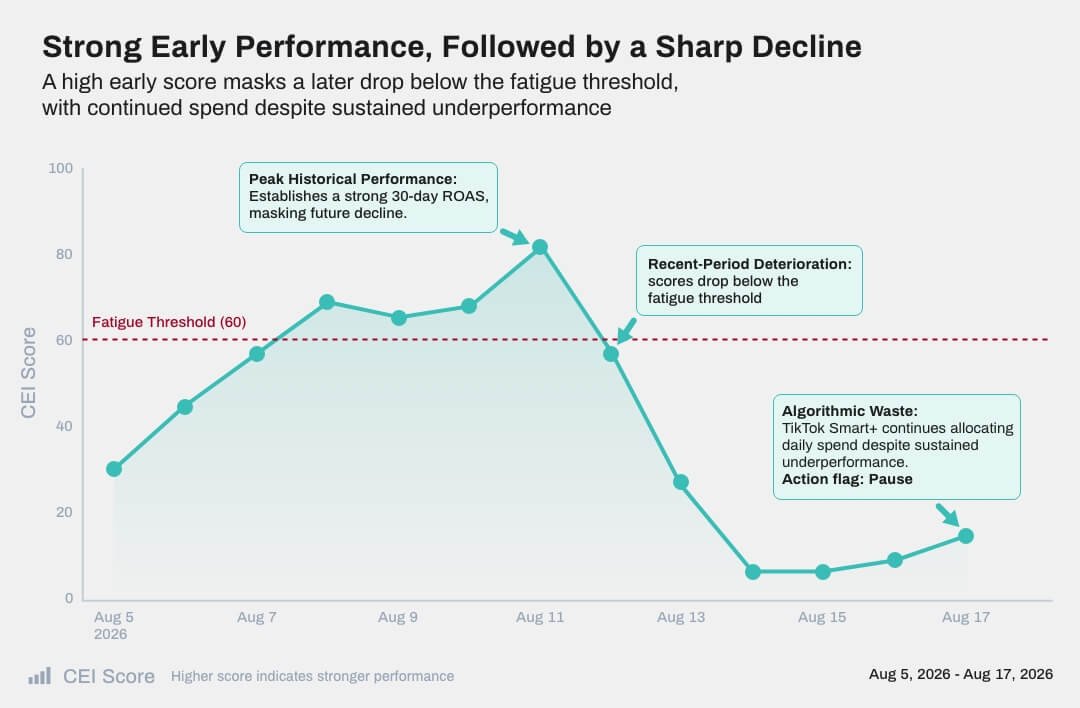
An ad can build up a strong performance history and then begin to deteriorate. Because earlier results carry considerable weight, its overall ROAS may still look perfectly healthy, completely masking the recent decline.
While managing a clients TikTok account, I needed to understand whether a specific asset still justified its current daily investment. To solve this, I built the Optimisation Hub to track individual ad lifecycles, comparing performance across 3, 7, 14, and 30 days alongside spend, time live, and changes since peak performance.
This time-horizon comparison made recent deterioration immediately visible. Using automated action flags, I could instantly assess whether to increase, maintain, reduce, or pause investment. A declining ad can still generate profitable revenue at a lower budget; reducing its spend preserves that contribution while freeing up budget to invest in stronger, scaling assets.
Illustrative example using demonstration data.
Creator rankings need a fair basis for comparison
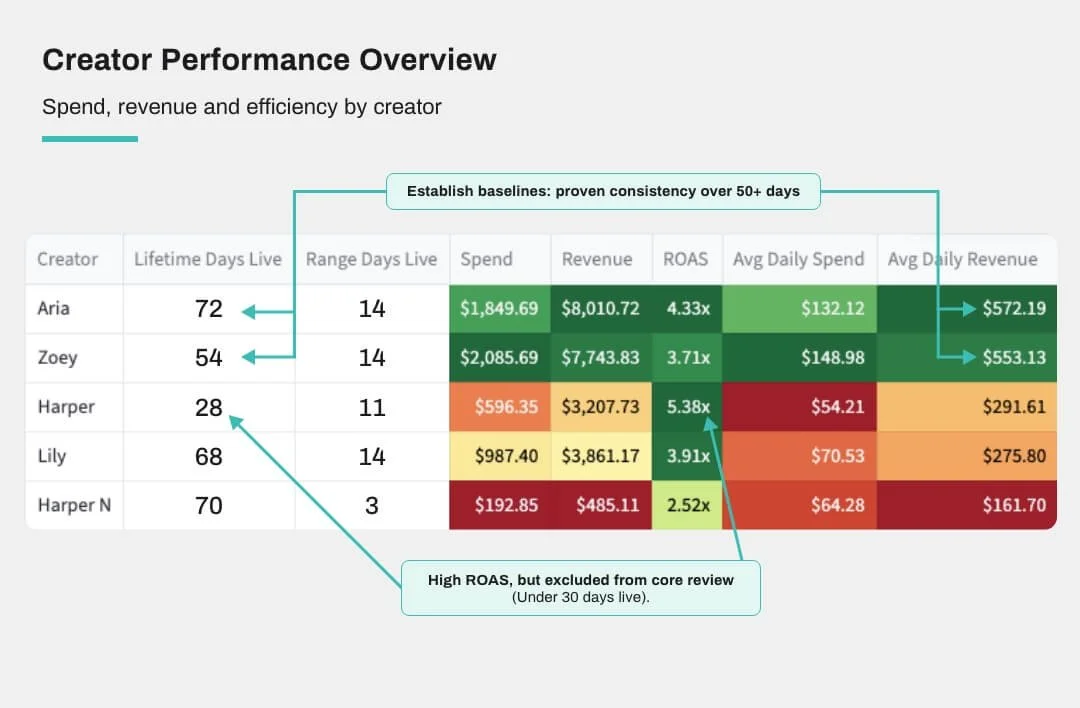
Reviewing total revenue by creator is a useful starting point, but creators rarely receive identical delivery opportunities. One creator may have been live for several months across multiple markets, while another may have launched recently with significantly less spend and fewer active days. Relying solely on total revenue reflects those delivery differences just as much as the actual performance of their content.
For the same account, I reviewed creator revenue alongside average daily revenue, spend, active days, and market coverage. During one Smart+ roster review, I implemented a strict 30-day eligibility rule, excluding creators who had not completed an initial full month of delivery.
Illustrative example using demonstration data.
I configure these specific review conditions based on delivery volume, the business model, and the immediate decision required. Establishing this statistically fair baseline helped distinguish genuinely weak performance from a naturally shorter delivery opportunity. Ultimately, this gave Nonsensical definitive, data-backed evidence for deciding whether to retain specific creators, extend proven content into new markets, or commission entirely new work.
The data processing behind useful marketing reporting
Much of the work happens before a chart or table ever appears on screen. The same raw advertising exports can support very different analyses depending entirely on how they are structured. A monthly campaign total may be enough for a top-level client summary, but daily asset-level data is essential to investigate exactly when performance began to weaken. I build the data processing and analytical logic behind each dashboard, giving the team reporting shaped around the decisions it needs to make.
My process follows six core steps:
Define the business question: Establish the exact decision, who will make it, and when it needs to be made.
Identify the data and required detail: Determine which sources are available and whether the analysis requires daily results, individual ads, specific markets, or developments.
Clean and structure the inputs: Standardise dates, identifiers, and classifications. Where appropriate, I use campaign naming conventions to organise activity by market, creator, format, or development.
Build the calculations and review rules: Develop the specific comparisons, pacing calculations, and account-specific conditions needed to investigate the question.
Validate the outputs: Reconcile calculations with source reports and investigate any discrepancies, ensuring periods, filters, and measurement definitions remain perfectly consistent.
Present the findings for use: Build a focused view that makes the evidence understandable and supports a clear, definitive next step.
Refreshing a report also means managing delayed data
A reporting update involves far more than simply adding yesterday's results. Previously reported figures frequently shift as a platform completes processing or updates its attribution. For example, Google’s GA4 documentation confirms that attribution credit for key events can change for up to 12 days after the event is recorded.
Working with one of my clients, I accounted for this attribution maturity by developing a rolling 14-day TikTok extraction process and reconciling the data throughout the nine-month engagement. I deliberately excluded incomplete intraday data from relevant analyses. The reporting had to make it explicitly clear which periods were fully comparable and where recent results still required qualification. Furthermore, advertising and website metrics retain their distinct source contexts; a platform-attributed purchase and a website-reported conversion use entirely different definitions, so I always establish that context before comparing them.
How reporting develops alongside the account
Working alongside Nonsensical, my engagement with one of their global ecommerce clients began with reporting support before I took full responsibility for paid account management in January 2026. As the programme rapidly expanded across 14 European markets, I evolved the reporting requirements directly alongside the campaigns.
I built the Reforge Metrics framework using Python and Streamlit, deliberately designing each module to answer a recurring operational question.
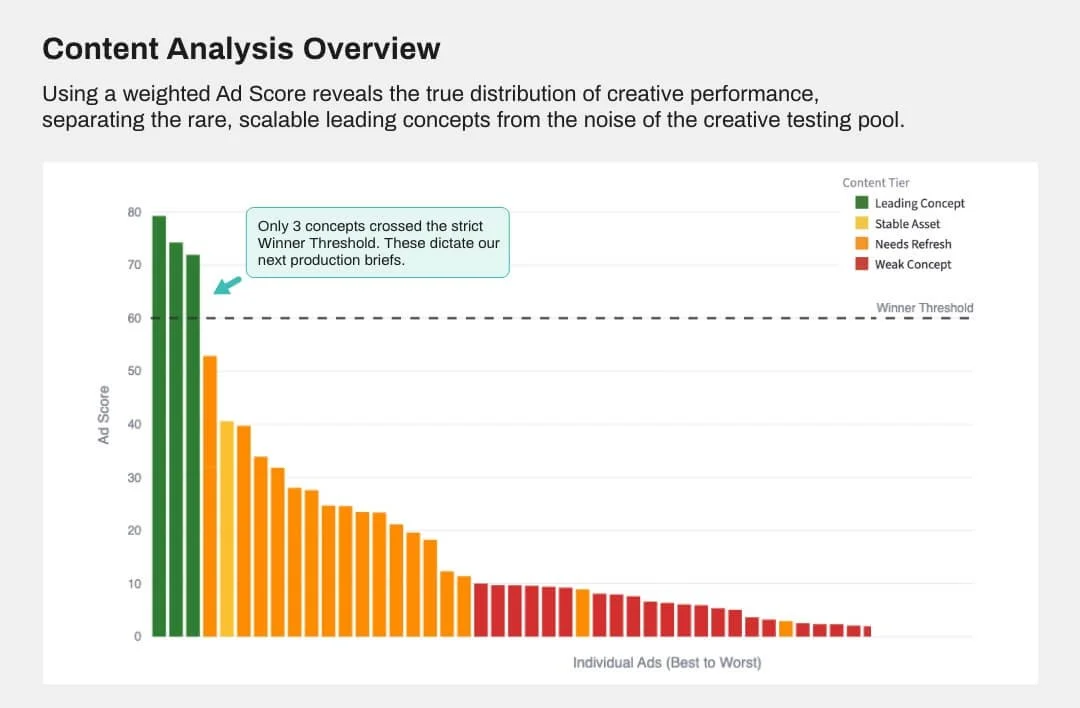
The Content Analysis framework, for example, supported a distinctly different decision from the Optimisation Hub. While the Hub managed daily media buying, Content Analysis helped me examine exactly what the agency could learn from an asset—identifying which hooks, messages, formats, and creative characteristics deserved further development.
Illustrative example using demonstration data.
Similarly, when TikTok’s shift to Smart+ fundamentally changed how spend was distributed within the creative pool, I completely rebuilt the campaign approach and reporting structure. The new analysis had to reflect the controls available under the automated setup and investigate whether assets genuinely justified the algorithmic investment they received.
In Q2 2026, the programme generated approximately $3.6M in TikTok-reported revenue at a 4.72x ROAS, with revenue increasing by 66% compared with Q1. Reforge supported my daily budget allocation, creative evaluation and campaign optimisation throughout that growth. When the Smart+ transition followed in Q3, I rebuilt the reporting around the new campaign structure.
Read the full agency partnership case study for a deeper breakdown of the engagement and results.
Different businesses need different reporting
An ecommerce account requires deep analysis around purchases, acquisition efficiency, creative performance, and market expansion. However, a housebuilder introduces entirely different commercial questions revolving around regional developments, complex website behaviour, and lead generation.
Working alongside the Unsworth Sugden Group agency, I developed a bespoke Reforge implementation for a UK housebuilder. The analysis had to bridge the gap between advertising performance and granular website engagement, making the results highly practical for reviewing individual housing developments.
This shift in industry also requires strictly defined outcomes. A brochure download, a telephone link click, and a completed enquiry represent entirely different levels of user intent. I isolated these distinct measures within the reporting to clearly identify where verified sales information was required to assess true commercial quality.
Conversely, for a fundraising organisation, the critical questions shift again toward donation revenue, acquisition costs, and campaign timing.
While my underlying analytical framework provides consistency across these diverse implementations, the actual data structure, reporting views, and review rules are always custom-configured around the specific client's business model and available evidence.
Read the full Unsworth Sugden Group case study for further context on this implementation.
Reporting stays useful when someone maintains and applies it
A reporting system requires ongoing attention as campaigns scale, commercial objectives pivot, and platform structures inevitably change. Maintaining its value involves updating classifications, validating data integrations, and adapting calculations whenever the underlying source data shifts.
However, the most important ongoing work is helping the agency team interpret the findings to decide exactly what to investigate, test, or change next. With Reforge Metrics, I agree on an update and consultancy schedule built entirely around those operational needs. A monthly client review and daily campaign monitoring require different update schedules. Your team can continue managing the advertising while I maintain the data processing and dashboard. Consultancy provides additional support with interpreting results, planning changes and developing new analyses.
Five questions to ask about your current reporting
Choose a dashboard your team uses regularly and ask:
Which recurring commercial decision does each view support?
Does it provide enough specific context to actually make that decision?
Can a media buyer easily investigate the underlying result?
Is the data current and complete enough for the decision?
Who is strictly responsible for acting on the finding?
These questions quickly identify whether your next operational improvement should be a clearer view, a better calculation, additional data, or a more consistent review process. They give your team a practical starting point for improving reporting without rebuilding everything at once.
Start with the question your report cannot answer
If your team is still manually rebuilding spreadsheets immediately after opening their dashboard, tell me which critical questions remain unanswered.
I build Reforge Metrics around the specific questions your team needs to answer. Where suitable data can be exported, I develop the structure, calculations, and reporting views needed to investigate it and extend the system as your requirements change.